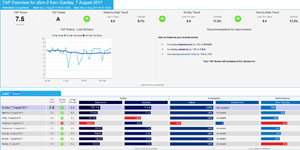
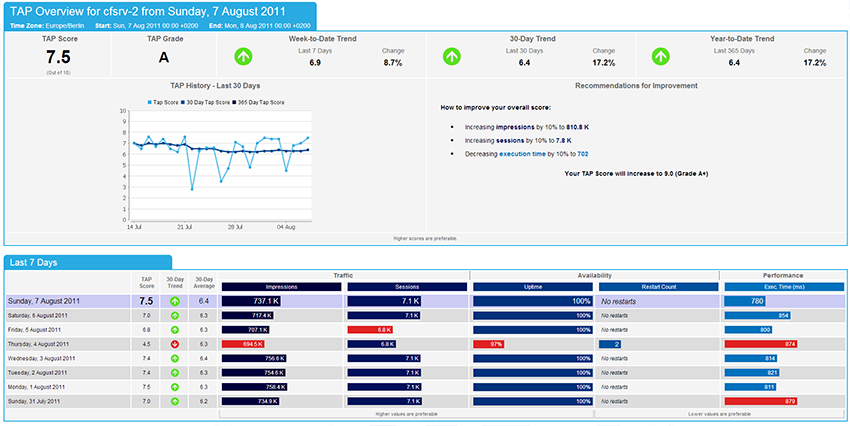
TAP Report
TAP provides a daily application score, rank and trend analysis, based on your systems’ Traffic, Availability and Performance (TAP).
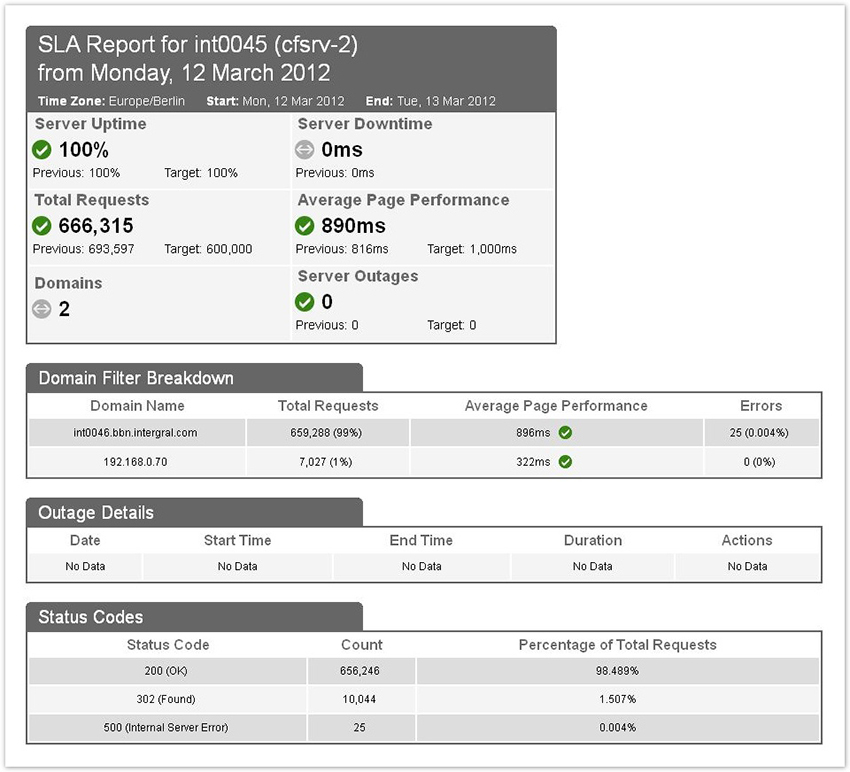
SLA Report
The SLA Report provides business-level information on your server’s performance. Choose to receive daily, weekly and monthly reports, compare to previous reports and even change the way the reports are displayed based on whether your server met your targets.
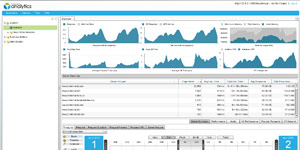
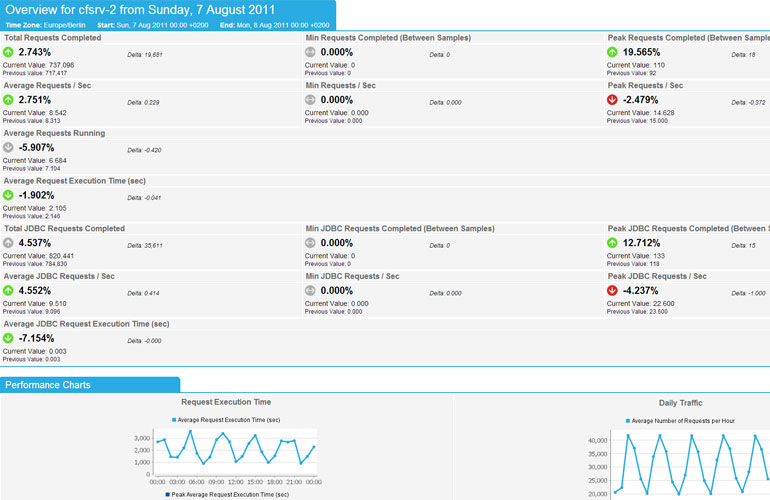
Daily Status Report
The Daily Status Report provides you vital statistics about the requests that have run in the last 24 hours.
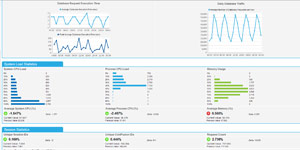
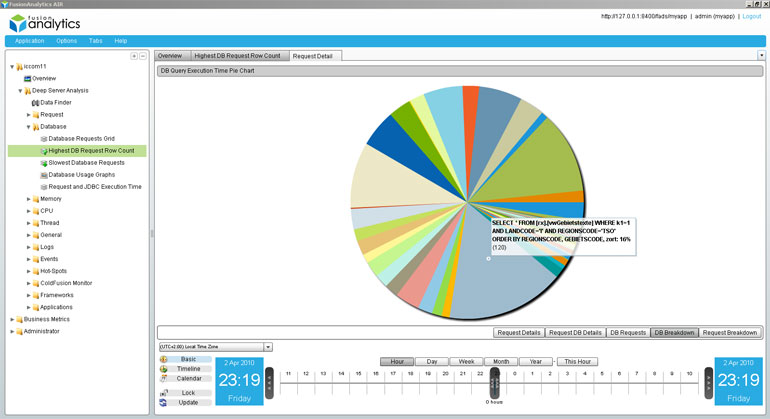
DB Breakdown
From within a request you can select the DB Breakdown tab, which shows us where the DB time is being spent on a query by query basis. Hovering over a segment of the pie chart will reveal the actual SQL statement being called.
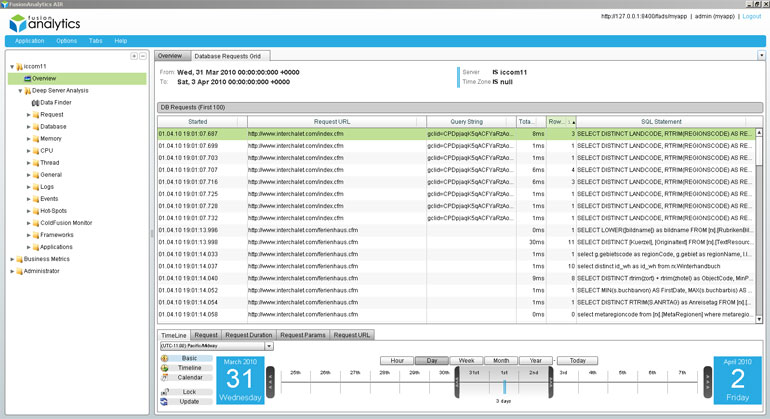
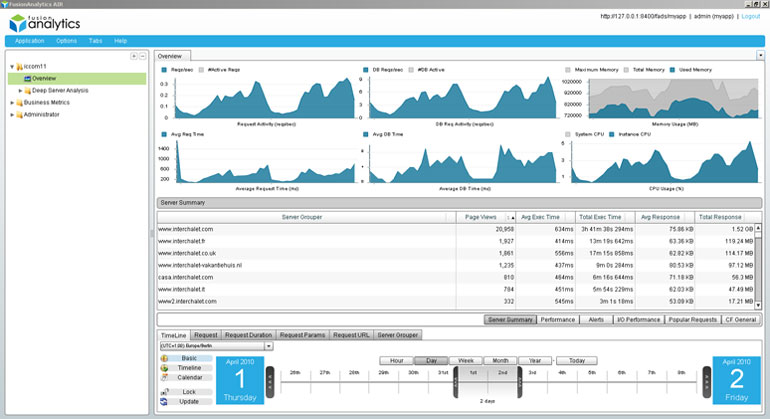
Overview
Quickly find out what exactly was happening when the server crashed at 3am this morning.
DB Request Grid
This perspective shows a breakdown of all the requests which have taken place over the selected time period. Details include time when the query ran, SQL query string, rows returned, DB Execution time etc.