FusionAnalytics Perspectives: Memory & CPU
The World of Deep Server Analysis
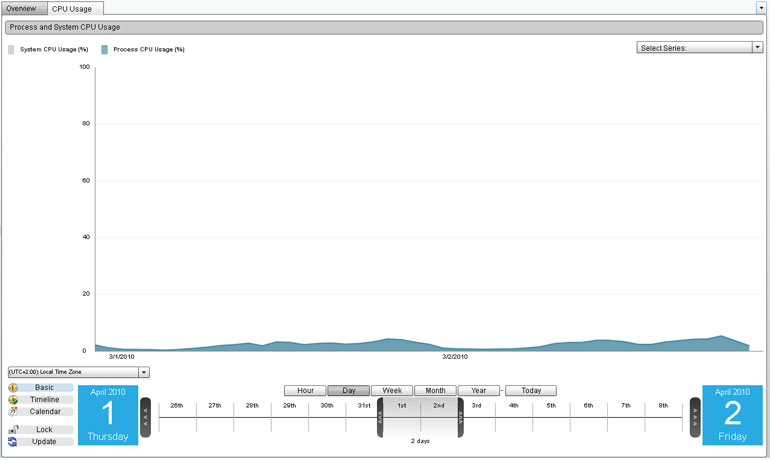
Process and System CPU Usage
Graph indicates the percentage of CPU being used by the process (across time).
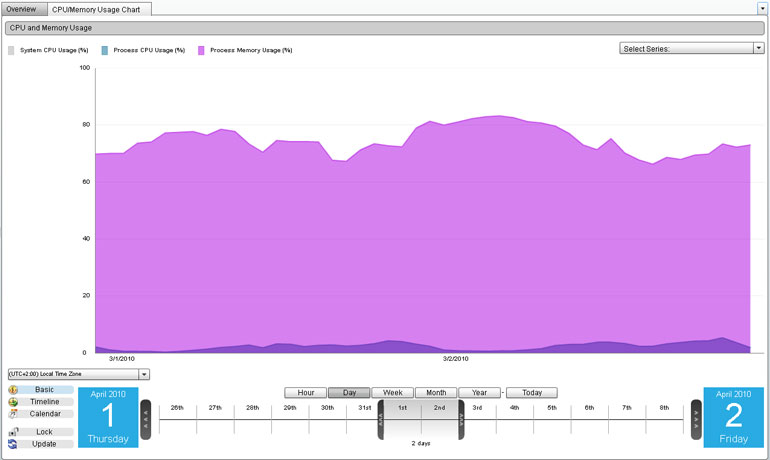
CPU and Memory Usage Chart
Compare Processes’ CPU usage and Process Memory usage in % (across time).
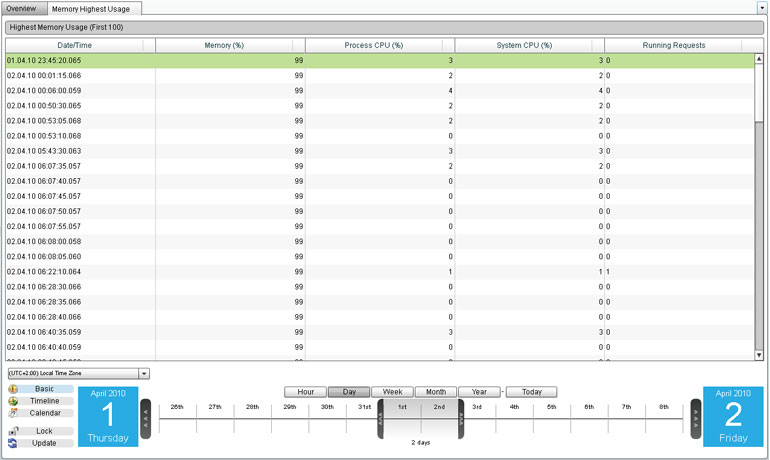
Memory Highest Usage
Determine at what point the system used the maximum amount of memory. For each point FusionAnalytics also shows how much Process CPU and System CPU was being used.