FusionAnalytics Perspectives: Requests
The World of Deep Server Analysis
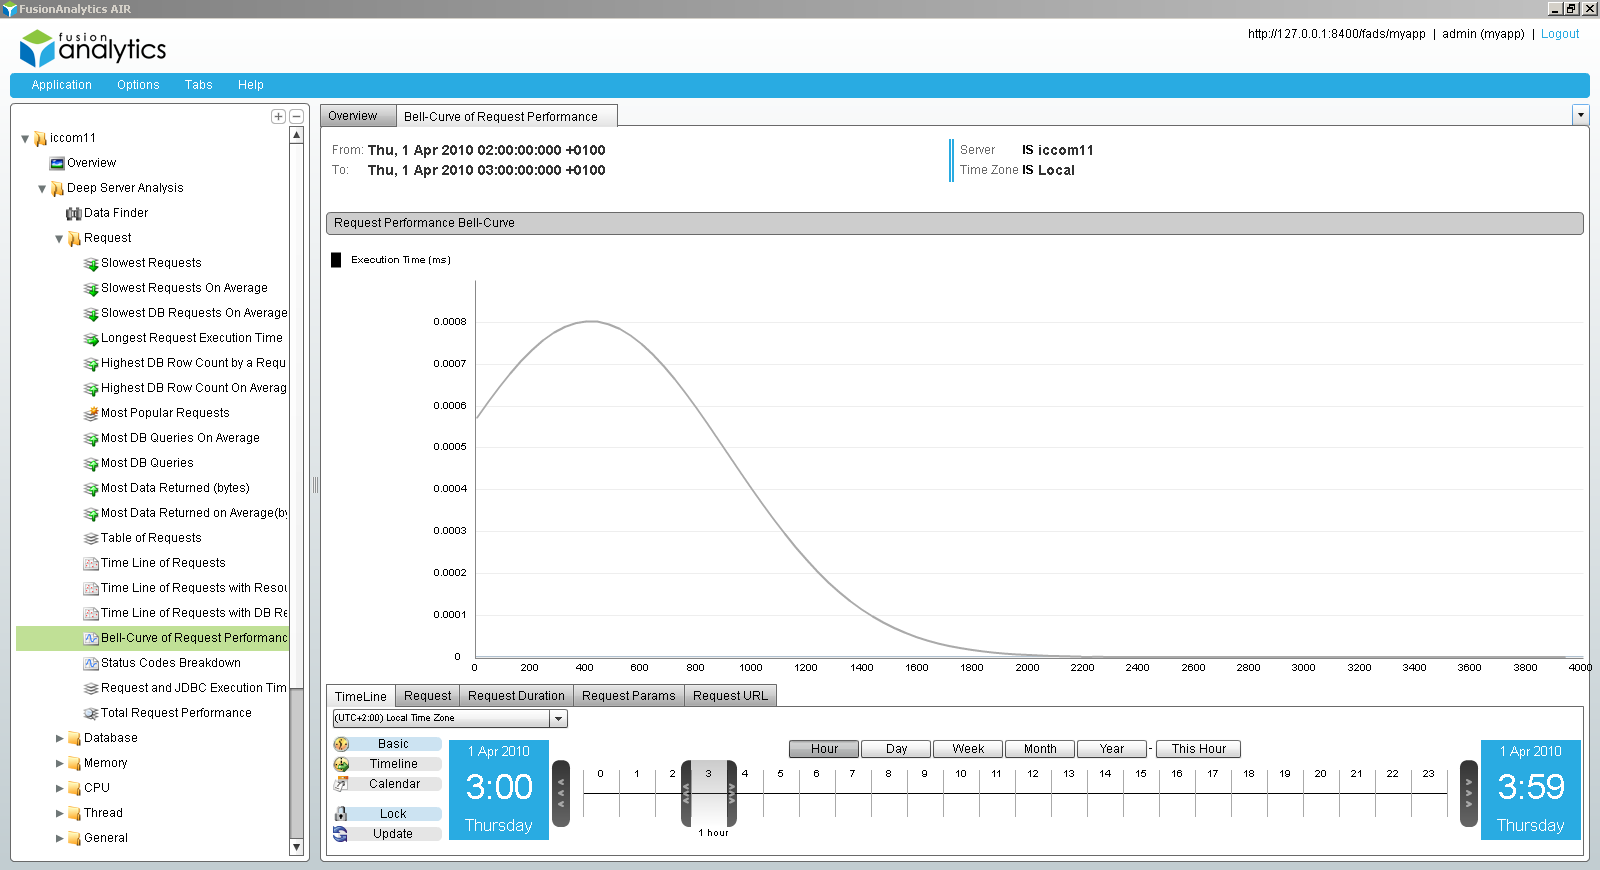
Bell Curve of Request Performance
Shows the Normal Distribution curve of request performance for the selected requests in the current TimeLine. Changing the zoom granularity i.e. showing fewer requests, will cause the bell curve to be immediately recalculated, showing the normal distribution for the currently ‘visible’ requests.
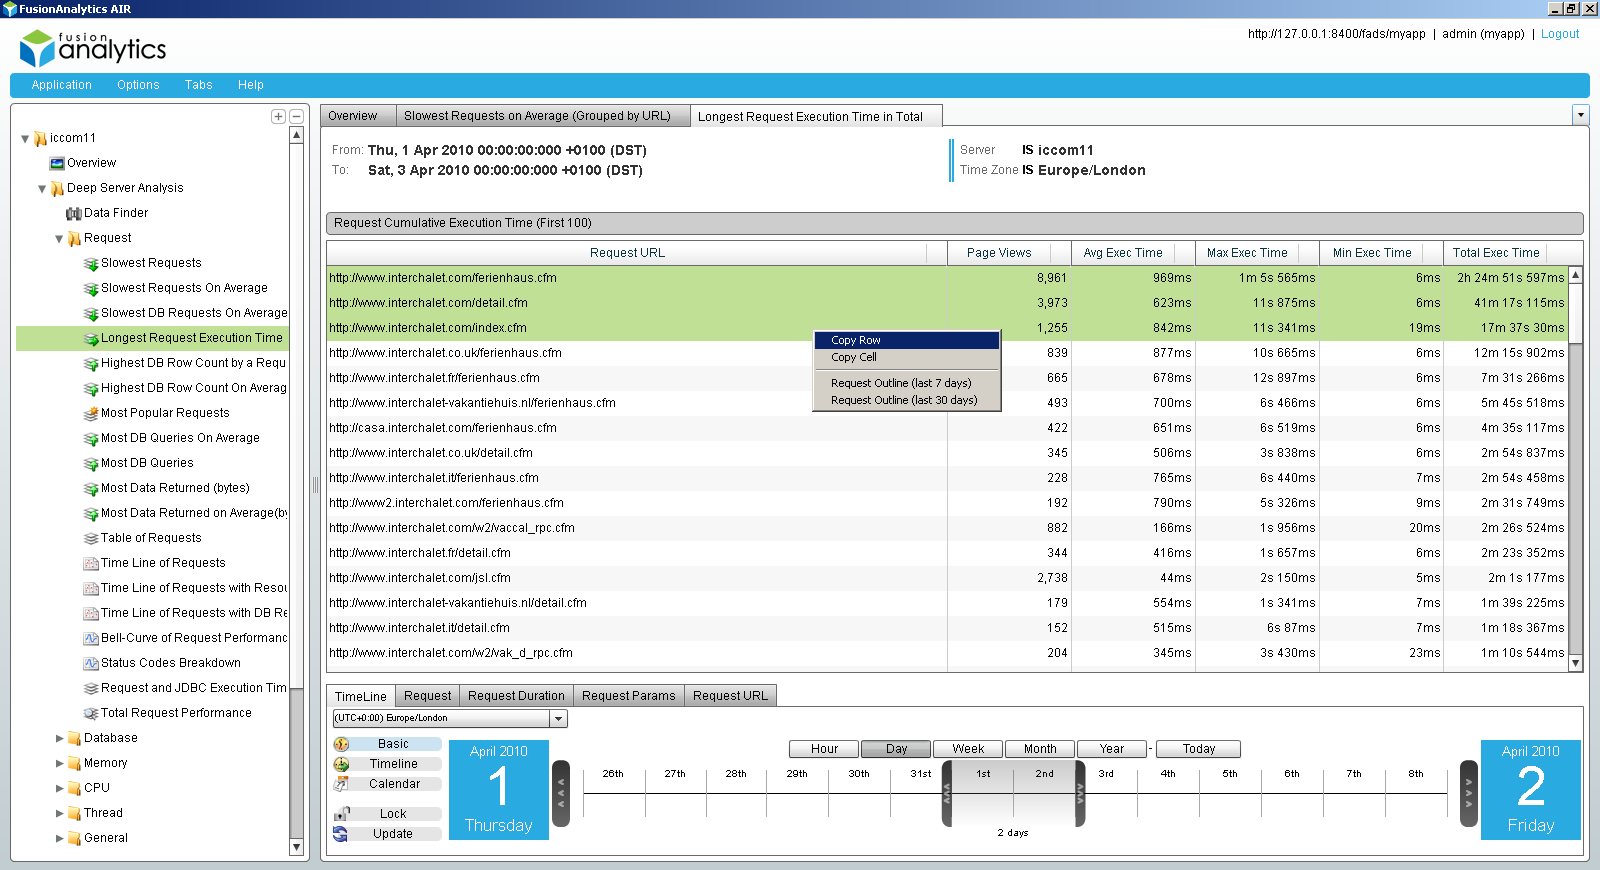
Longest Request Execution Time
Using this view you can categorize server usage per URL. Finding a slow-running page or most frequently requested page is not enough. By taking into account both average execution time and page view count a picture of total resource usage is built up. Detailed analysis can then be performed to identify key locations for optimization. For example, drilling into a request to the most resource-intensive URL (easily found through the right-button menu) reveals outline details such as start time and stream metrics such as client download speed.
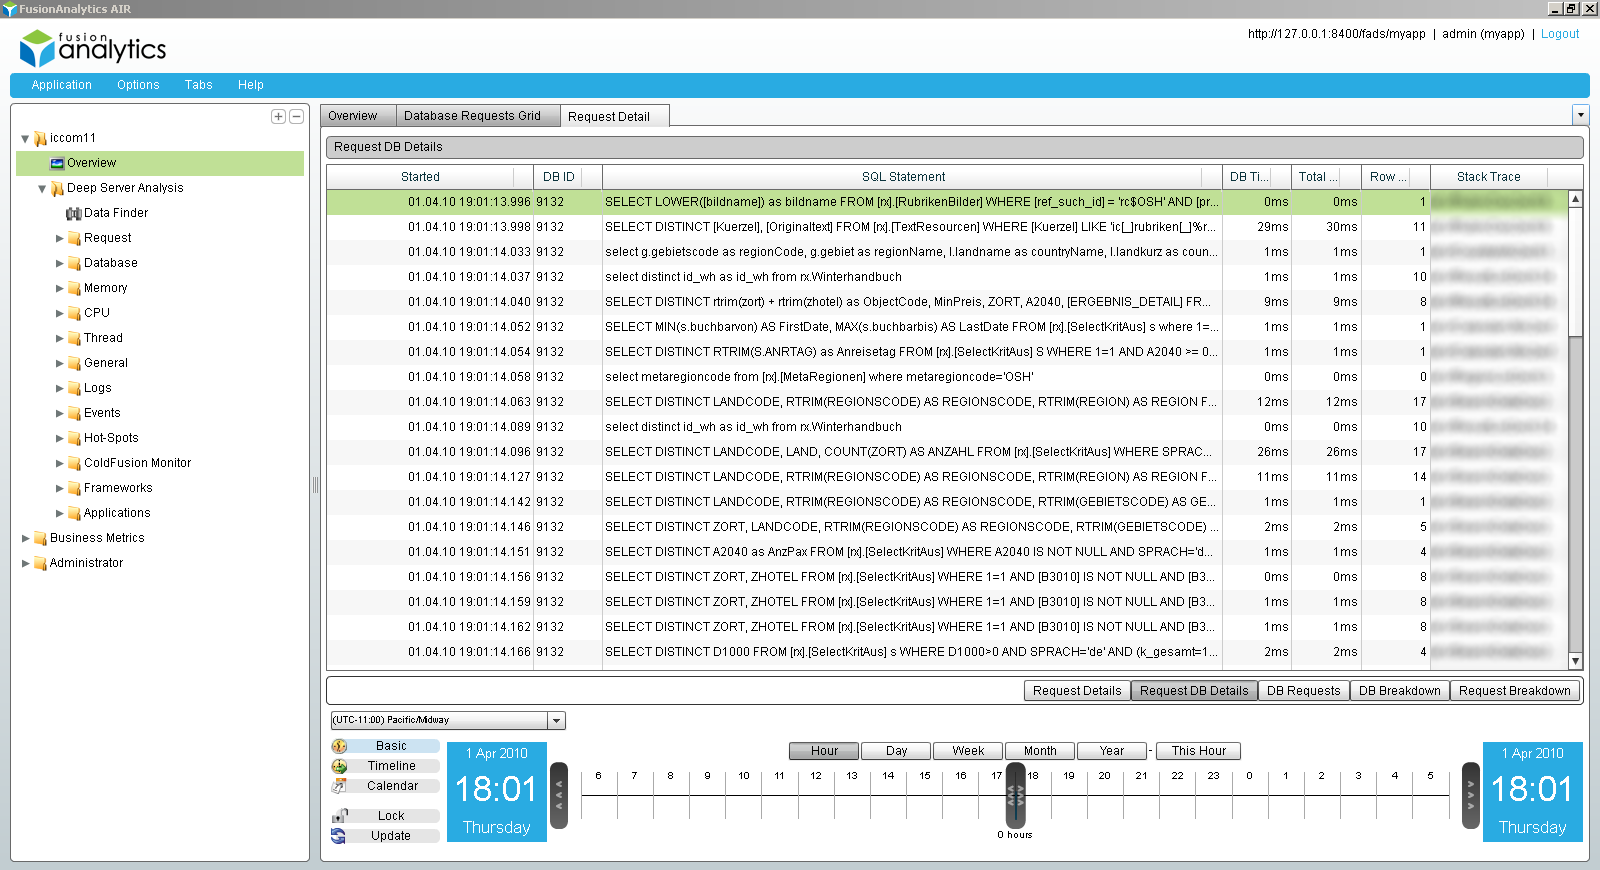
Request Detail – Request DB Details
Shows all details of the selected request. This is broken down into different tabbed views containing the Request Details and various DB Request Details. Displays a complete breakdown of ALL the select statements contained in one single request thread.